|
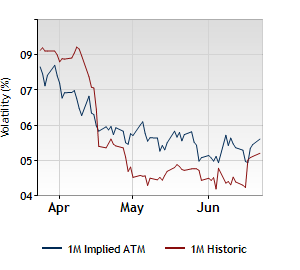
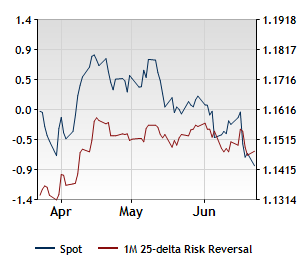
EURUSD CHARTS
|
|
|
Implied vs. Historic Volatility
|
Risk Reversal vs. Spot
|
 |
 |
|
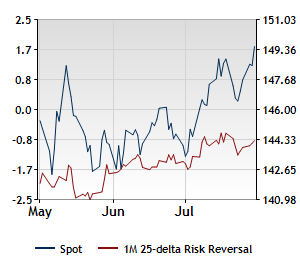
USDJPY CHARTS
|
|
|
Implied vs. Historic Volatility
|
Risk Reversal vs. Spot
|
 |
 |
|
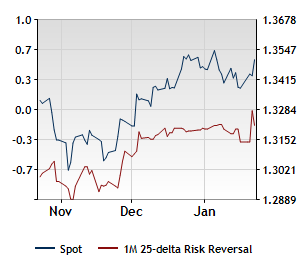
GBPUSD CHARTS
|
|
|
Implied vs. Historic Volatility
|
Risk Reversal vs. Spot
|
 |
 |